Geo-Information Scientist | Spatial Data Storyteller & GIS Developer
📍 Location: Wageningen, Netherlands 🎯 Seeking: A role as a Geodata Analyst, GIS Consultant, or Spatial Developer with an employer eligible for kennismigrant sponsorship.
BEng Geodetic Engineering Universitas Gadjah Mada (UGM) | 2019
💼 Core Competencies:
• Spatial Communication & Public Engagement: Creating interactive StoryMaps and tools for community & stakeholder engagement.
• End-to-End Geospatial Solutions: From data acquisition (GPS, drones) and analysis (ArcGIS, QGIS, R) to web development and cartographic design.
• Data Science for Spatial Problems: Predictive modeling, spatial statistics, and dashboard development for environmental and urban challenges.
• Participatory GIS & Heritage Visualization: Bridging technical data with local knowledge for cultural tourism and planning.
This portfolio showcases my journey from academic research to professional project delivery, highlighting my ability to transform complex spatial data into clear insights and actionable tools.
Developing an Integrated Geo-Platform for Cultural Tourism and Heritage Management (Zuid-Veluwe, NL)
This professional internship project involved the end-to-end development of an integrated geospatial solution for regional development. Tasked with supporting the Zuid-Veluwe initiative, I was responsible for creating a central platform that makes the region's rich agro-heritage discoverable and actionable.
The solution combines advanced GIS analysis, web development, and cartographic design. I synthesized data from cadastral services, historical archives (AHN), and participatory workshops to model historical landscape features. Using ArcGIS Online, I then built a responsive StoryMap application that serves as the digital hub, featuring interactive maps, detailed narratives, and media. To drive real-world engagement, I analytically designed 12 cycling/walking routes—complete with distance, difficulty, and thematic highlights—and produced high-quality topographic and thematic maps for download.
This platform now serves multiple stakeholders: the municipality uses it for planning and education, local cooperatives use it for marketing, and tourists use it for exploration. It showcases my competency in managing a complex geo-data project from concept to delivery, with tangible outputs that serve both strategic policy goals and public engagement.
Ede-Wageningen Sustainability Map is a web application derived from ArcGIS Online export results, created in the Remote Sensing and GIS Integration course (GRS60312). The main users of this application are local people and tourists who are interested in sustainability, as well as academics or researchers who need in-depth data.
The aim of the visualization is to promote sustainable places in Ede-Wageningen, support local initiatives in increasing sustainability awareness, and encourage sustainable local tourism. With interactive maps that can be accessed online, information about sustainable places can be disseminated easily and attract the interest of tourists and local residents.
The process of creating this application starts from collecting and analyzing data in ArcGIS Pro, then exporting it to ArcGIS Online to create interactive maps that can be accessed via the web, as well as prepared in print form for those who prefer physical maps.
Geo Data of Olist Marketplace in Brazil
Geo Data of Olist Marketplace in Brazil (Data Management - INF21306) is an application that presents a map containing the population of Brazil, number of Olist customers, market penetration, delivery times, and review scores per state, complete with graphs and statistical tables. This application is aimed at business people who want to build or expand their online business on the Olist platform, who need demographic information, market penetration, delivery times and review scores to make better business decisions.
This visualization aims to provide valuable insights into geolocation data and statistics, helping businesses identify potential markets, evaluate delivery efficiency, and improve strategies based on customer reviews. The implementation process involves collecting data from open sources, processing data with MySQL, extraction for visualization, and presenting data through interactive maps and statistical dashboards.
Olist Marketplace Statistics Data in Brazil
MGI WUR's Fieldwork Project
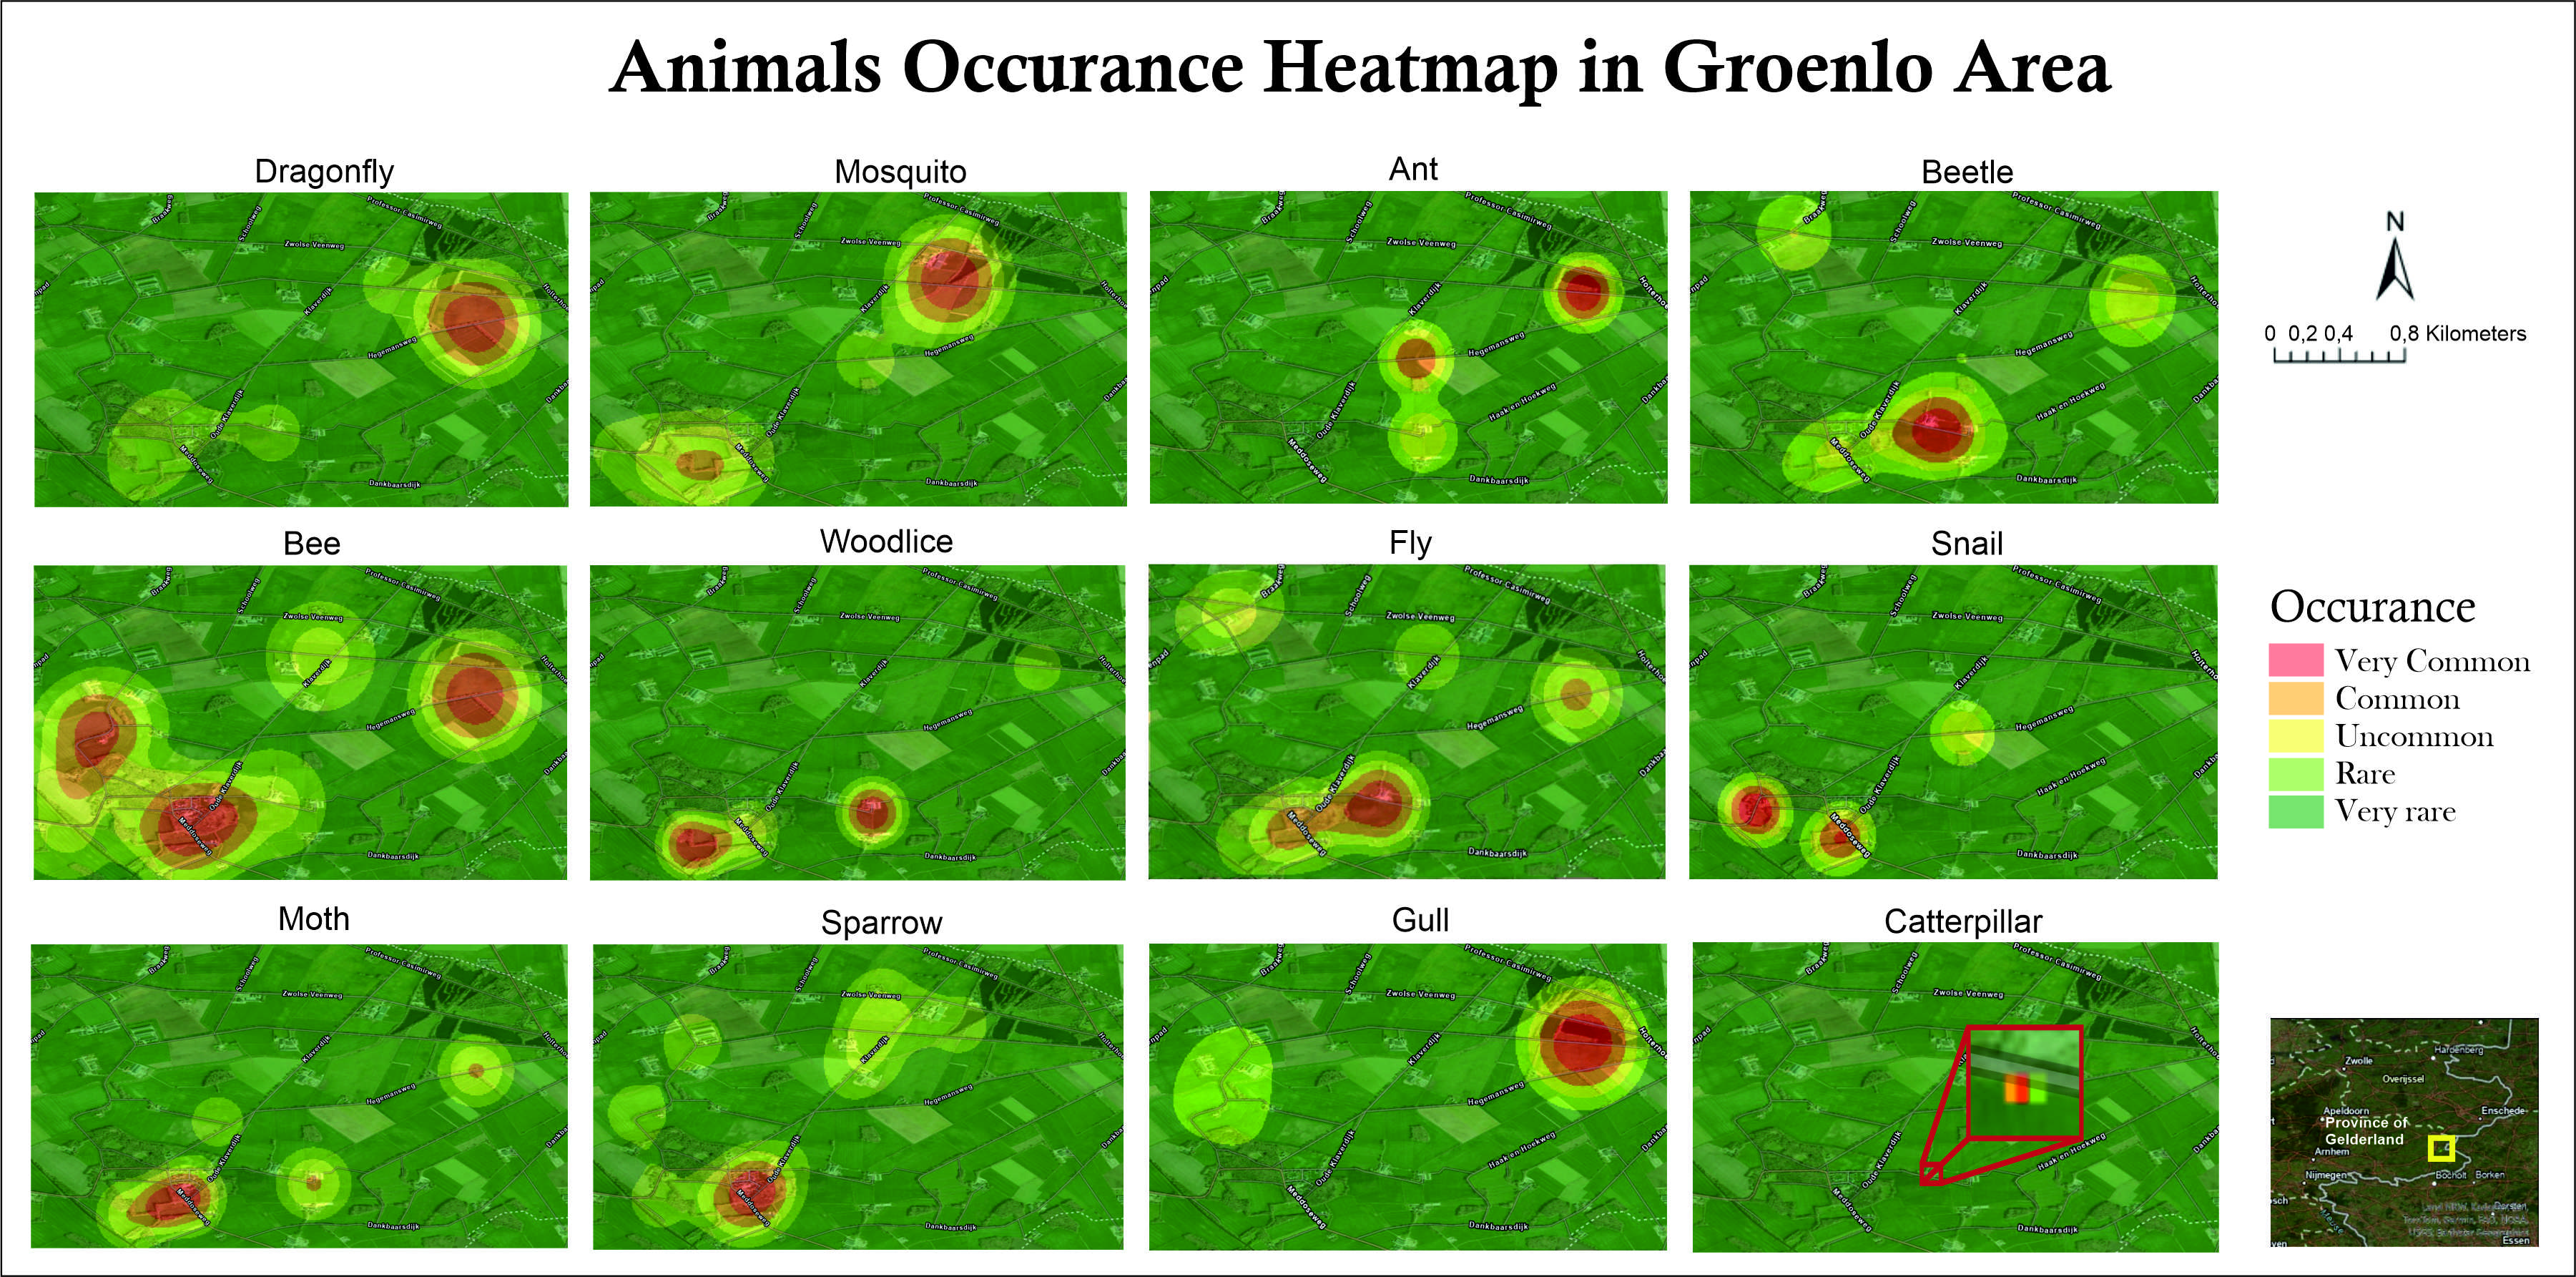
The project "Animal Occurrence Heatmap in Groenlo Area," undertaken as part of the course "Remote Sensing and GIS Integration (GRS60312)," focuses on mapping 12 different animal species within Groenlo, Netherlands, using a heatmap visualization. This application serves multiple purposes, catering to various stakeholders such as municipality Groenlo, scientists, and biologists. For the municipality, the heatmap provides critical spatial data on animal distribution for effective wildlife management. Scientists and biologists utilize the map for spatial analysis to support research and conservation efforts concerning these species.
Implementation involves the use of GPS handheld devices to collect data points in KML format, which are subsequently processed using Kernel Density estimation to generate a heatmap with distinct classes. This methodical approach ensures that the spatial representation of animal occurrences is both accurate and informative. Furthermore, the data derived from this visualization serves an additional purpose in the augmented reality game ZooGo. Integrated as a game function, it enhances player experience by notifying them of specific animal-rich areas as they explore the virtual environment, thereby blending real-world spatial data seamlessly into the gaming interface. This dual application underscores the versatility and practicality of GIS and remote sensing technologies in both scientific research and interactive entertainment contexts.
Traffic, Properti Price, and EV station Map in Delhi, India
The Traffic, Property Price, and EV station Map of Delhi, India, developed for the course "Data Science for Smart Environment (GRS35306)," integrates various data points crucial for urban analysis. It visualizes Delhi's traffic scores, property prices, and the density of EV charging stations on a postcode basis, using a color gradient where darker shades indicate higher values. This map serves multiple stakeholders: the Delhi Provincial Government can utilize traffic scores to formulate effective policies on private vehicle restrictions. Property developers benefit from insights into metropolitan areas highlighted by property prices, aiding strategic business decisions. Additionally, providers of EV charging services, electric vehicle users, and governmental bodies find value in identifying optimal locations for charging stations.
Implemented using ArcGIS, the map aggregates data sourced from TomTom, government websites, and other open sources. This ensures robustness in data visualization and analysis, supporting the initial goal of correlating air pollution with these urban parameters.
Virtual Reality Game of Wageningen
Virtual Reality Game of Wageningen, developed as part of the eXtended Realities and the Future of Communication course (GRS60312), immerses players in the scenic landscapes and landmarks of Wageningen. This VR game is designed with the mission to explore various key locations within Wageningen, where specific buildings and points of interest will dynamically appear with accompanying explanations. The application targets both tourists and locals, aiming to deepen their understanding and appreciation of Wageningen's cultural and historical significance through interactive gameplay.
The primary goal of the visual experience is to create an immersive virtual environment using Unity game engine and C# programming language. The visualization aims not only to entertain but also to educate users about Wageningen, thereby promoting the city as a tourist destination. By leveraging VR technology, the project seeks to engage users with realistic simulations and detailed narratives of Wageningen's landmarks, enhancing their virtual exploration and fostering a deeper connection to the city's heritage and attractions.
SOC Objective Comparison Maps
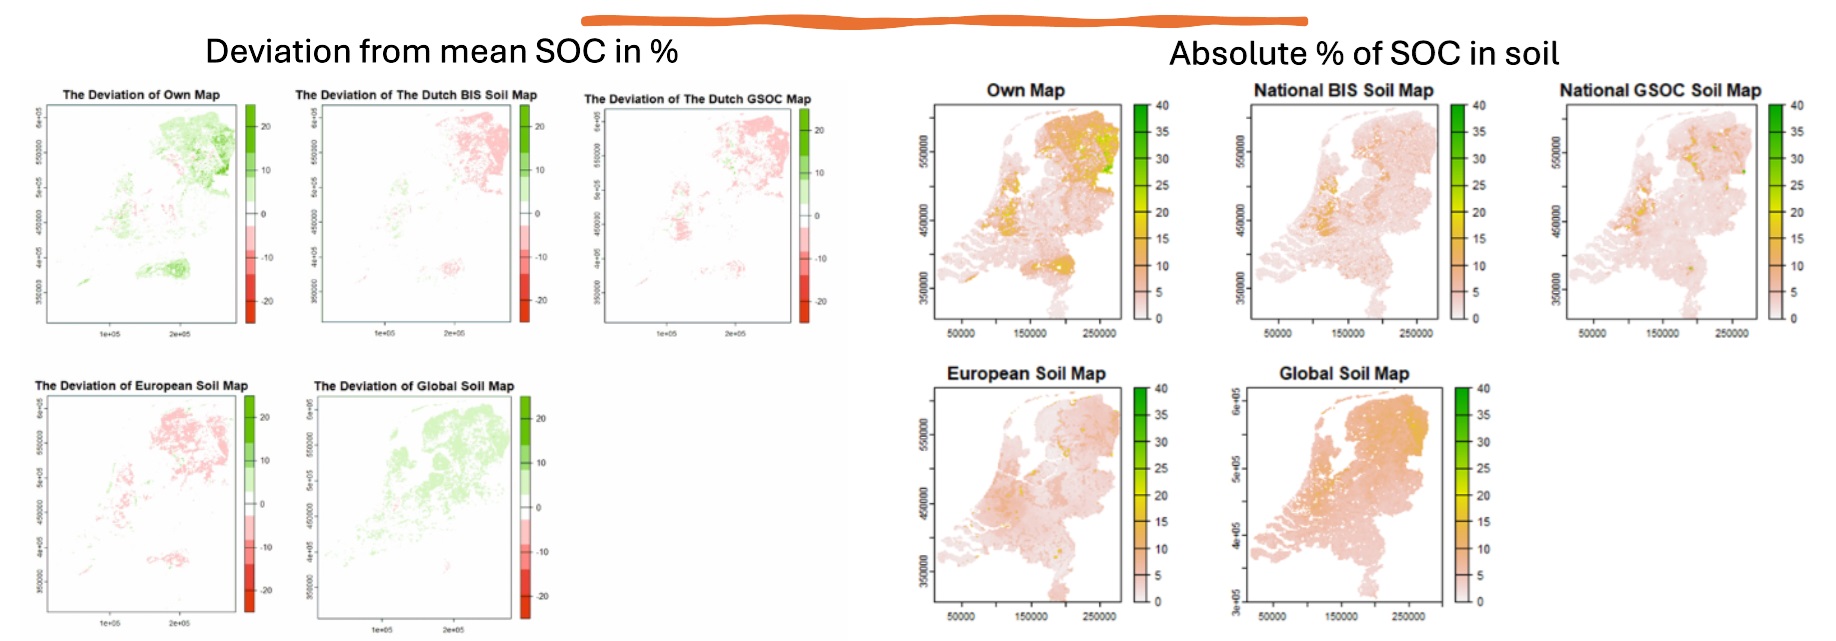
SOC Objective Comparison Maps is part of the Spatial and Temporal Analysis for Earth and Environment (GRS33306) course which aims to carry out objective comparisons between internal SOC maps and several other map sources. The main purpose of this visualization is to study techniques for comparing values between data sources objectively, which is very relevant for academic and research needs in temporal and spatial analysis of the environment and the earth. Intended users include students, researchers, and professionals in the fields of earth and environmental sciences who require an in-depth understanding of the map data comparison process for soil data repositories.
The implementation of this concept uses R's main tools to create visualizations. Internally generated SOC maps were printed in R, while externally sourced SOC maps were obtained from multiple sources. This approach reflects the use of technology that is relevant to the learning objectives and analysis needs desired in the context of the GRS33306 course.
Spatial and Temporal Analysis Project
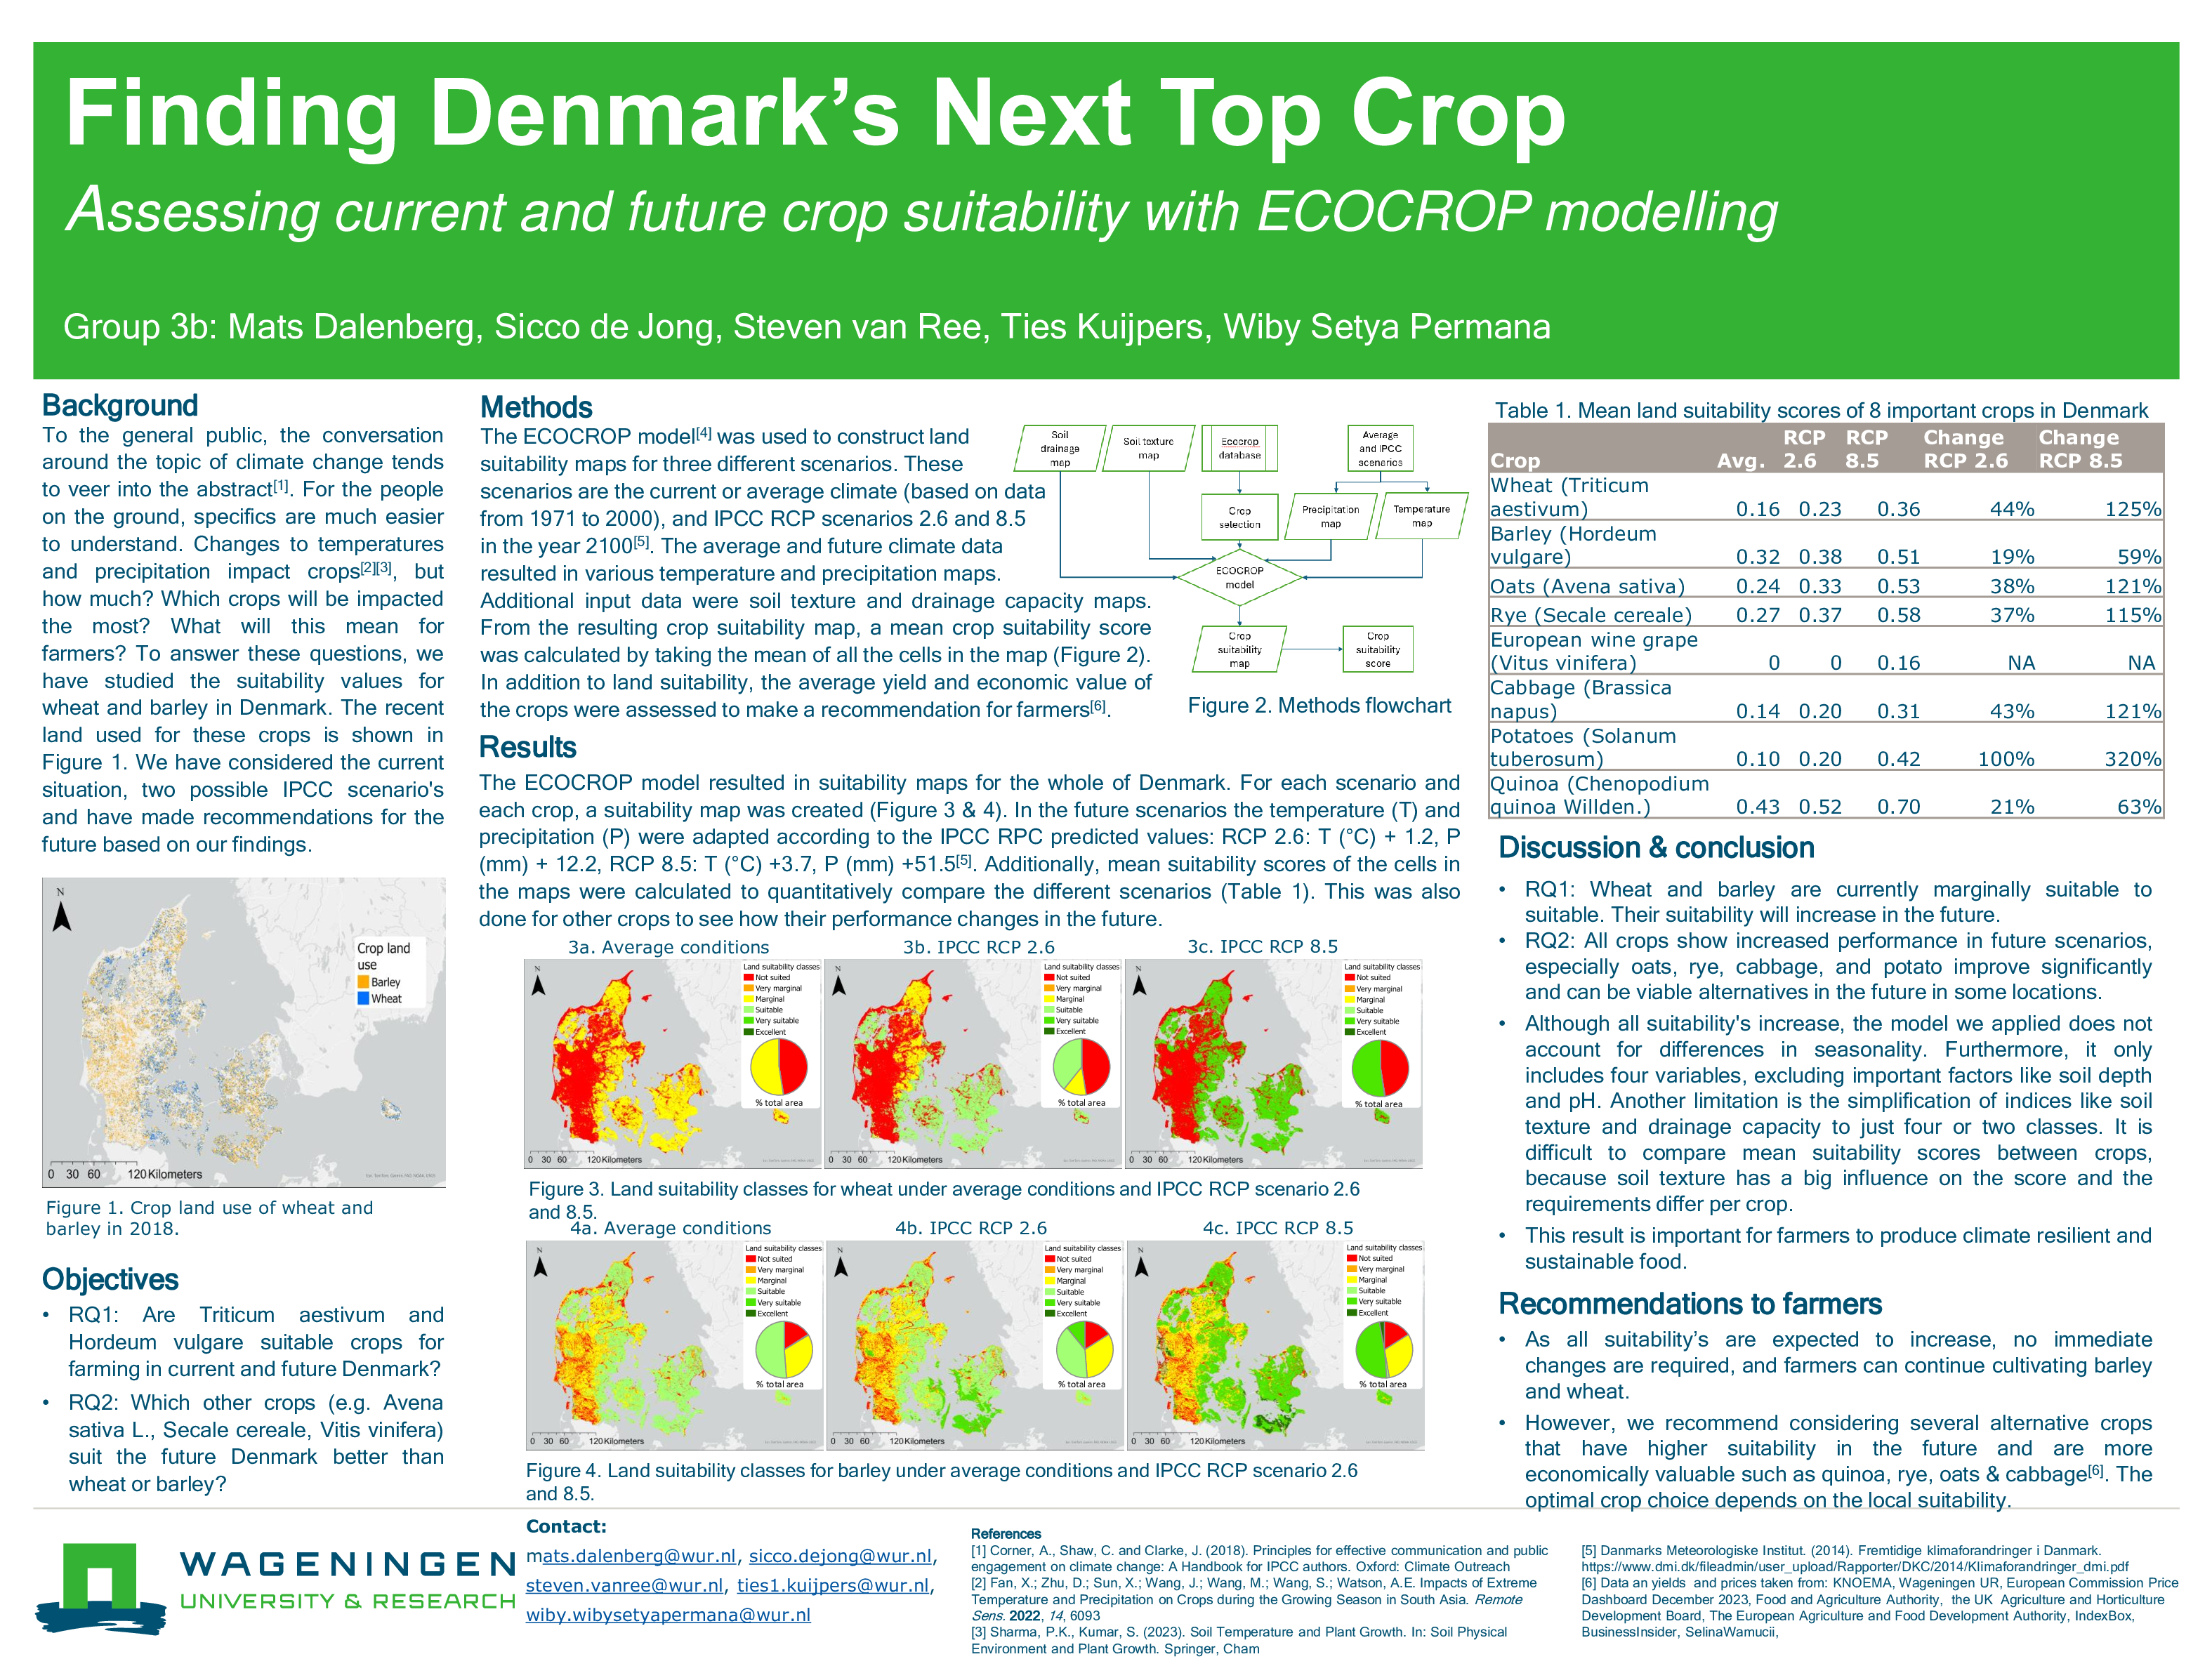
The scientific poster "Finding Denmark's Next Top Crop" is an integrated project in the Spatial and Temporal Analysis for Earth and Environment (GRS33306) course. This poster aims to determine the optimal locations in Denmark suitable for growing wheat and barley in the future. The main target of this visualization is farmers in Denmark, who need clear and detailed information on the most suitable areas for farming based on IPCC 2.6 and 8.5 climate conditions. Thus, this poster not only provides academic value in the context of temporal and spatial analysis, but also has significant practical applications for local agricultural communities.
To achieve this goal, the implementation process uses R as the main tool for visualizing spatial data. The use of R was chosen because of its advantages in data analysis and geospatial visualization, which allows the creation of maps that are informative and easy to understand for farmers. By using R, this poster not only provides information about the most suitable locations for growing wheat and barley, but also guarantees the reliability and accuracy of visualization results that can be used directly in agricultural decision making. Thus, this project is not only academically relevant but also makes a real contribution to practical applications in the field of sustainable agriculture in Denmark.
Deforestation Prediction in Borneo, Indonesia
Geoscripting (GRS33806) is a course focusing on developing a dynamic online map predicting deforestation in Kalimantan, Indonesia. This map serves multiple users, including the Indonesian government for formulating forest resource management policies and international organizations concerned with biodiversity and forest conservation to monitor deforestation in Borneo. The visualization aims to forecast potential deforestation levels in specific areas, using orange pixels to indicate higher probabilities. Implemented using R programming language and Folium, it facilitates accurate and accessible deforestation predictions for effective environmental planning and protection efforts.
Here is below the reflection, People Purpose Process (PPP), and detail information about those projects